What's Happening in Your Neighborhood?
Your First Five Minutes with Chicago's Civic Data Just Got Much Easier

If you've ever wondered what your neighborhood's civic data could tell you, but felt intimidated by spreadsheets and government portals, you're not alone. CommuniData transforms Chicago's wealth of collected data into an intuitive platform that community organizations can actually use. No data science degree required.
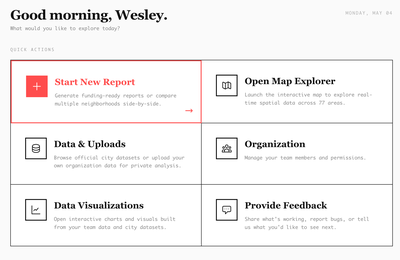
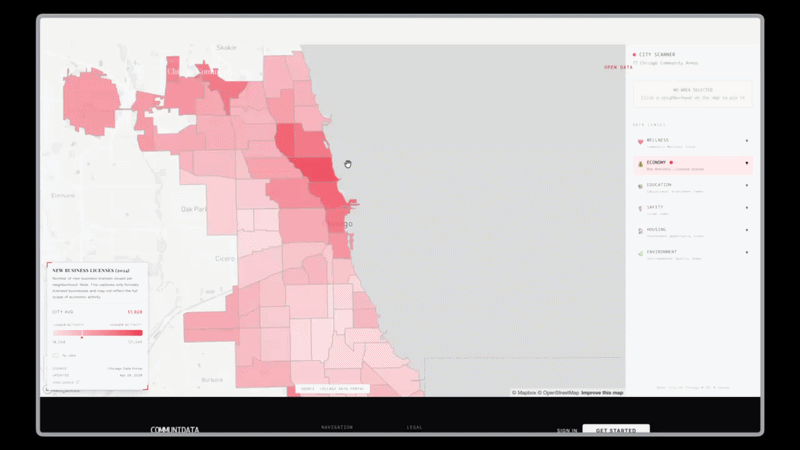
Start Where You Are: Selecting Your Community Area
When you first load up CommuniData, you'll see Chicago's 77 community areas displayed on an interactive map. Simply click on your neighborhood, whether that's Lincoln Park, Pilsen, or Bronzeville, and you will see an overview of the selected data types. You can use the filter on the left hand side to cycle through health, housing, education, economic, safety, and environmental key indicators.
This geographic focus is crucial because community organizations work hyperlocally. Instead of wading through citywide statistics that may not reflect your reality, you see data that directly relates to the residents and businesses you serve. For example, if you're a chamber of commerce in Logan Square, you'll instantly access business licensing trends, demographic shifts, and economic indicators specific to your area. Putting actionable data into your hands is the goal of this platform and the map explorer only scratches the surface of what you can do.
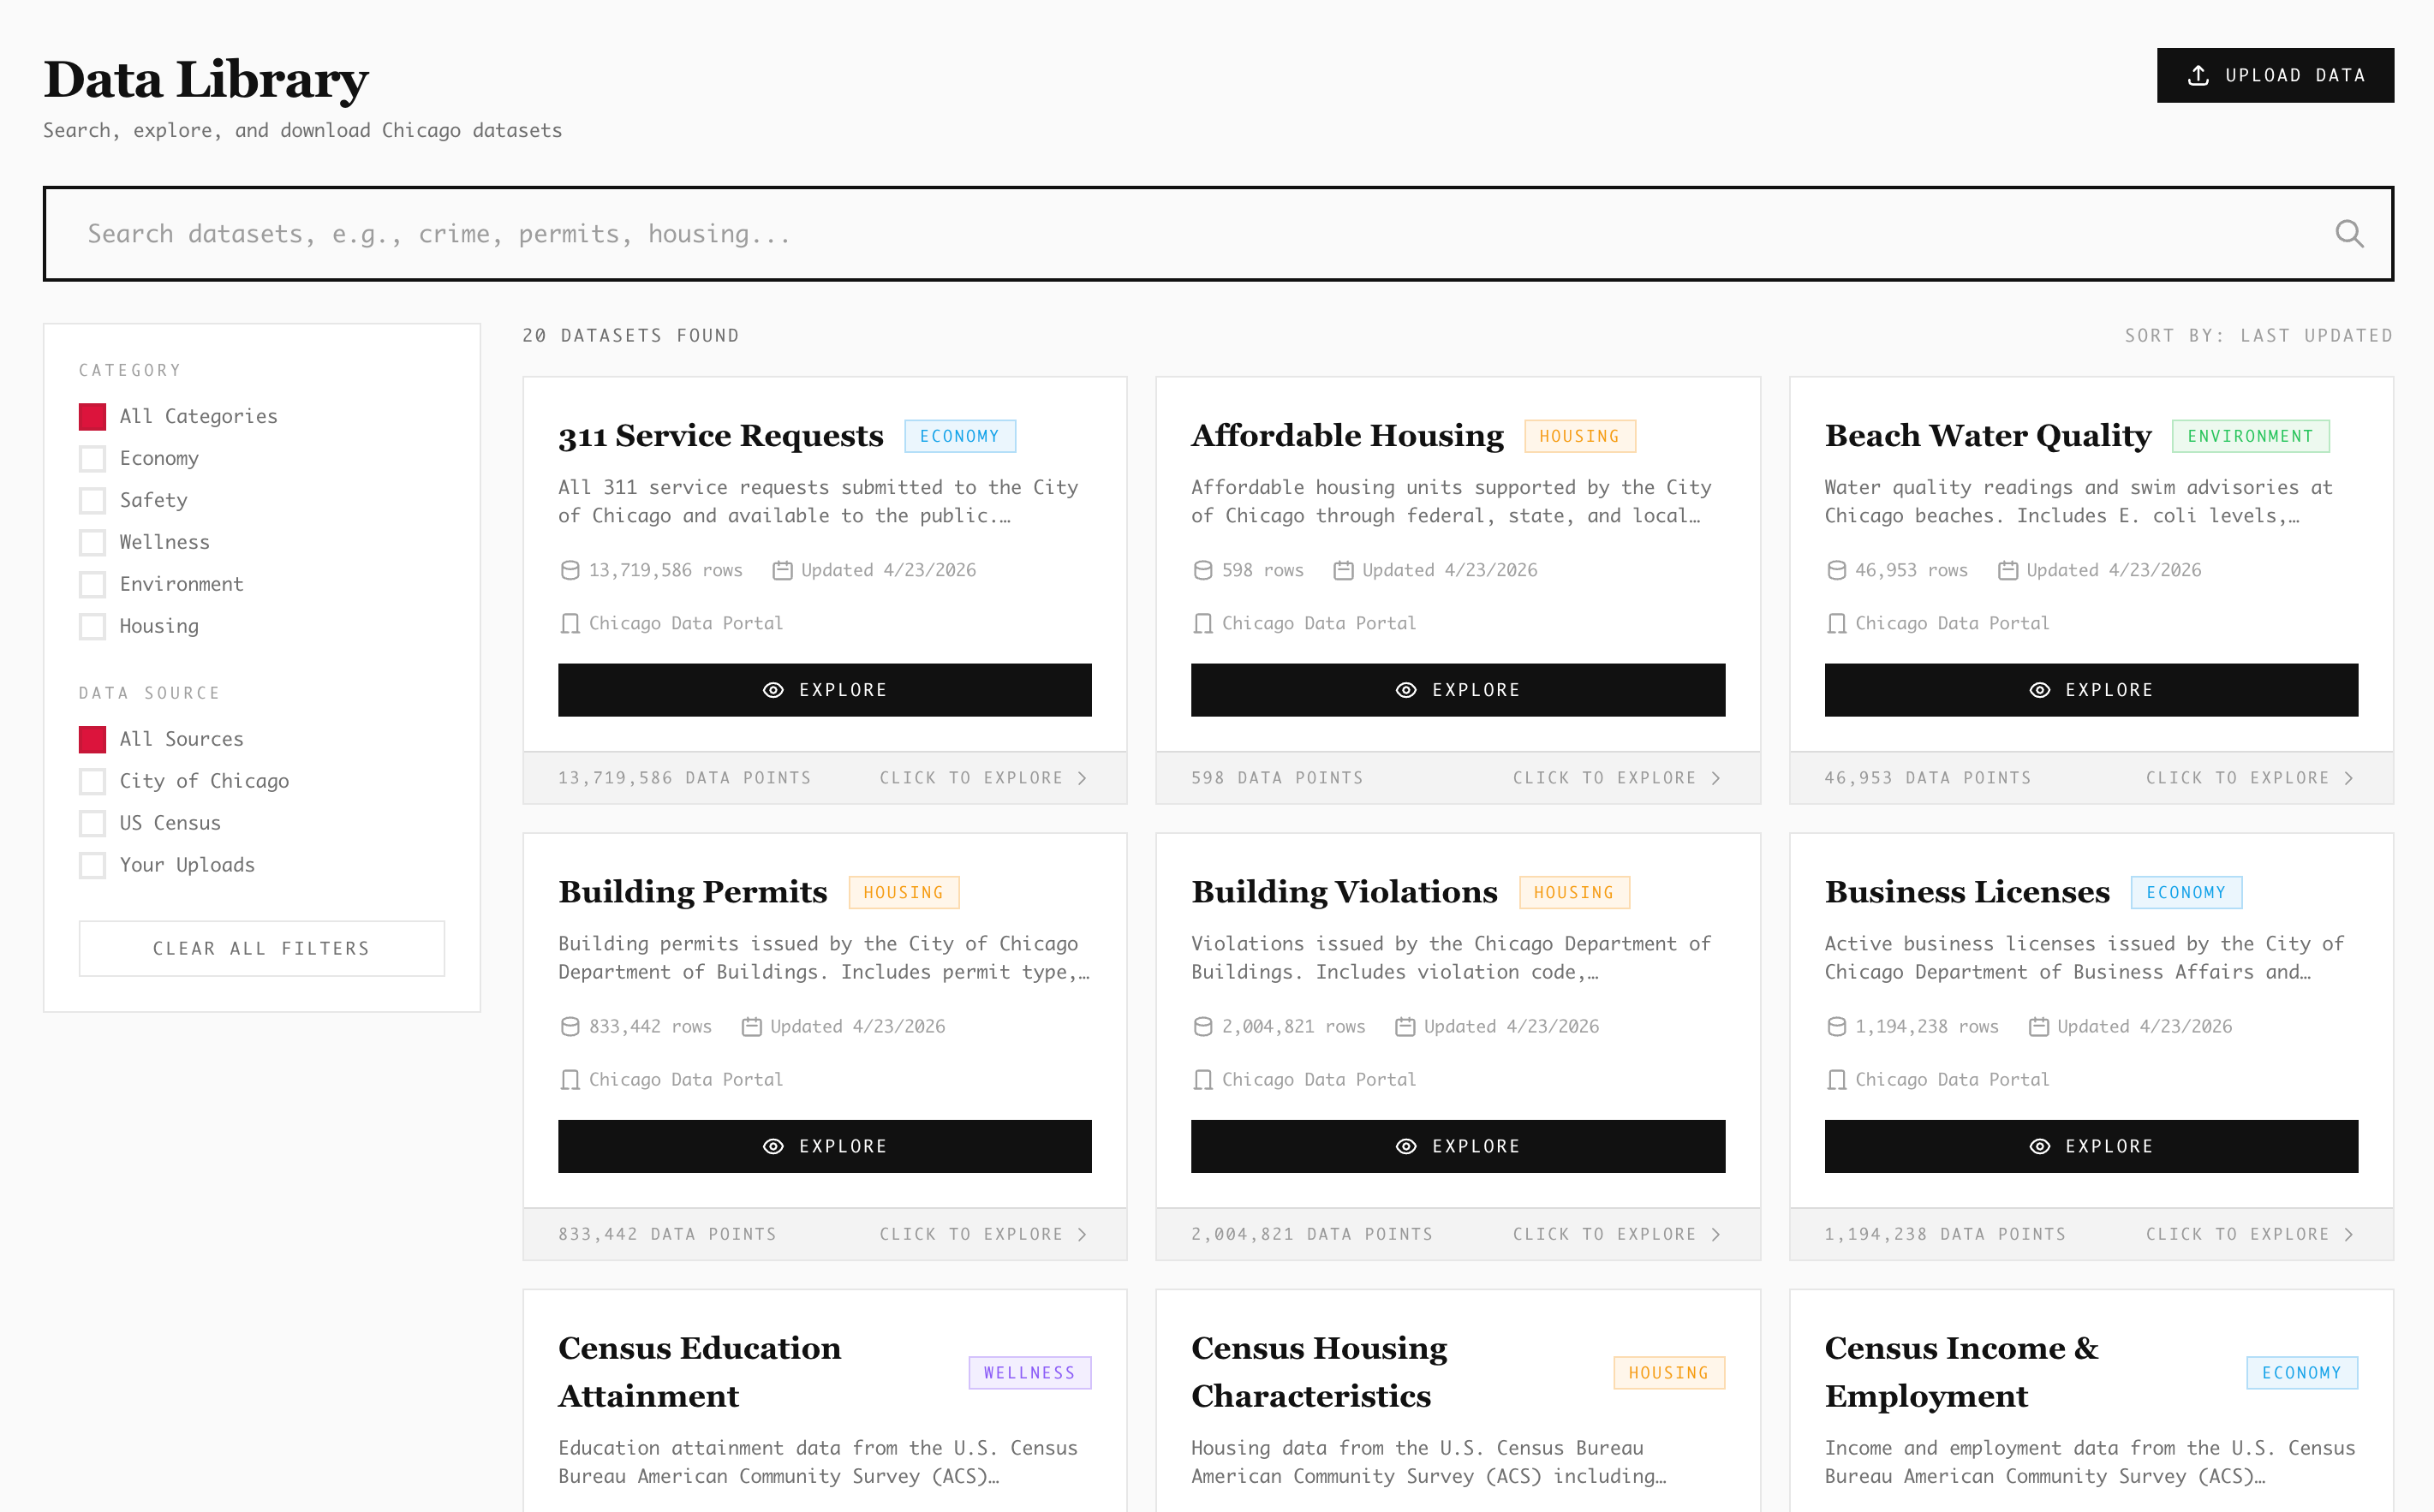
Explore Datasets That Match Your Mission
Once you've logged in, you can browse the collection of datasets offered through the Data Library. CommuniData presents datasets organized by category: economic development, housing, transportation, education, environmental, and public safety. Each dataset includes a plain language description explaining what the data measures, where it comes from and why it matters to community organizations.
Let's say you run a workforce development nonprofit. Click on "Business Licenses" and you'll see which types of businesses are growing in your area, helping you understand where job opportunities might emerge. The "Building Permits" dataset reveals where new construction is happening, potentially indicating neighborhood investment patterns. Rather than hunting through multiple city departments for this information, it's all centralized and prefiltered for your community area.
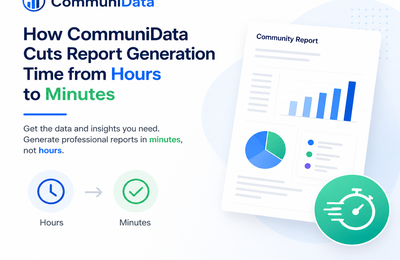
Turn Numbers into Actionable Insights
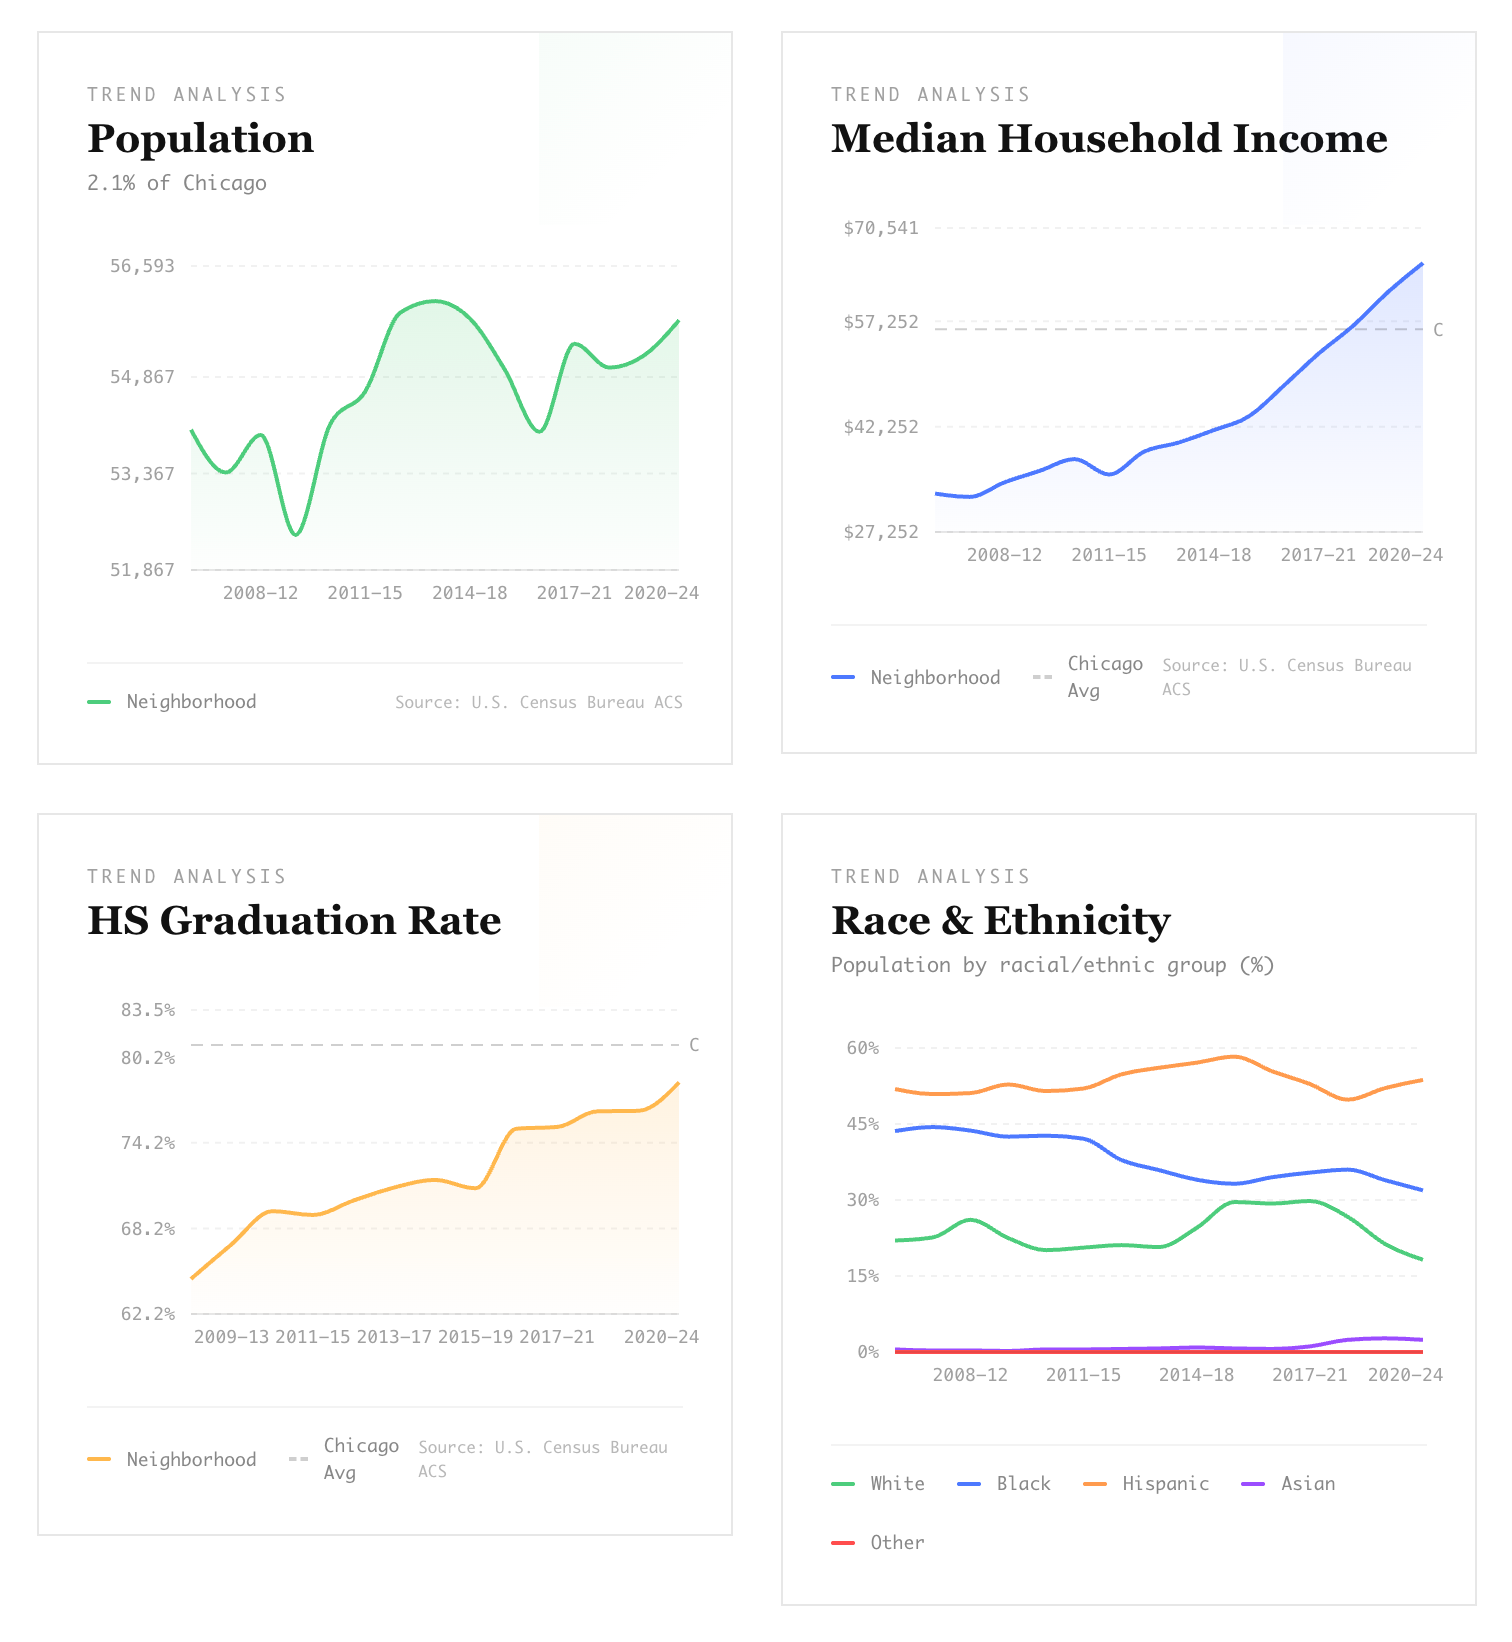
The real power emerges when you start connecting datasets to your organization's goals. CommuniData doesn't just show you numbers, it presents them in charts, maps, and trend lines that reveal patterns over time. Save, edit, and share beautifully designed PDF reports and interactive dashboards.
A community development corporation might discover that while residential building permits increased 45% in their area over two years, commercial permits remained flat. This insight could inform advocacy priorities or grant applications. Business development groups can track which license types are trending upward, helping them tailor programming to emerging industries. The platform's visualization tools make these patterns visible without requiring advanced analytical skills.
Build Your Data-Informed Strategy
Most community organizations already collect some data: membership numbers, program attendance, or service requests. CommuniData helps you contextualize this internal information within broader neighborhood trends.
If your nonprofit's youth programming saw increased demand, checking population data might reveal whether this reflects demographic changes or indicates unmet need. A chamber of commerce planning a business attraction campaign can use licensing data to identify gaps in local services. This context transforms your organization's anecdotal observations into evidence-based insights that strengthen funding proposals and strategic planning.
What This Means for Community Organizations
Chicago's civic data holds answers to questions you're already asking about your neighborhood, and CommuniData makes finding those answers straightforward. You don't need to become a data expert — you just need five minutes to explore what's already available about your community area.
Ready to see what insights await in your neighborhood's data? Sign up for the CommuniData application and discover how civic information can strengthen your organization's impact.
From the Author
Ready to see what insights await in your neighborhood's data?
Sign up for the CommuniData application and discover how civic information can strengthen your organization's impact.
Sign up! →Related Journals