From Data to Report in Under 2 Minutes
How CommuniData Cuts Report Generation Time from Hours to Minutes

Chamber directors and program managers know the drill: board meetings loom, stakeholders demand updates, and funders want databacked proposals. Yet pulling together neighborhood statistics often means hours of hunting through government websites, wrestling with spreadsheets, and formatting findings into presentable reports. What if that entire process took less time than brewing your morning coffee?
The Hidden Time Drain in Community Work
How much time do you spend gathering and collecting data? Chances are it’s a lot more time than you wish it was. CommuniData isn't just about efficiency, it's about opportunity cost. Every hour spent wrestling with census data or economic indicators is an hour not spent on strategic planning, community engagement, or program development.
The challenge isn't just finding the data. Government databases are notoriously difficult to navigate, with information scattered across multiple agencies and presented in formats that require significant cleanup. Even when you locate the right statistics, translating raw numbers into compelling narratives for different audiences such as board members, city officials, or potential partners, requires additional time and expertise.
Most community leaders end up bookmarking dozens of websites, maintaining their own spreadsheets, and recreating similar reports from scratch each time they need to demonstrate impact or make a case for resources.
The TwoMinute Report Revolution
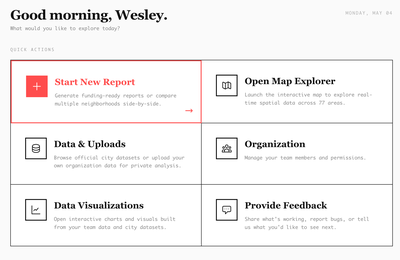
CommuniData's report generation feature transforms this multi-hour process into a streamlined workflow. Simply select a specific neighborhood, ward, or business district and choose from dozens of preloaded data categories, and generate professionally formatted reports in under two minutes.
The platform pulls from live government databases, ensuring your statistics are current and accurate. Housing data comes directly from the Chicago Department of Housing, economic indicators from the Bureau of Labor Statistics, and demographic information from the latest American Community Survey. No more wondering if your numbers are outdated or questioning data sources during presentations.
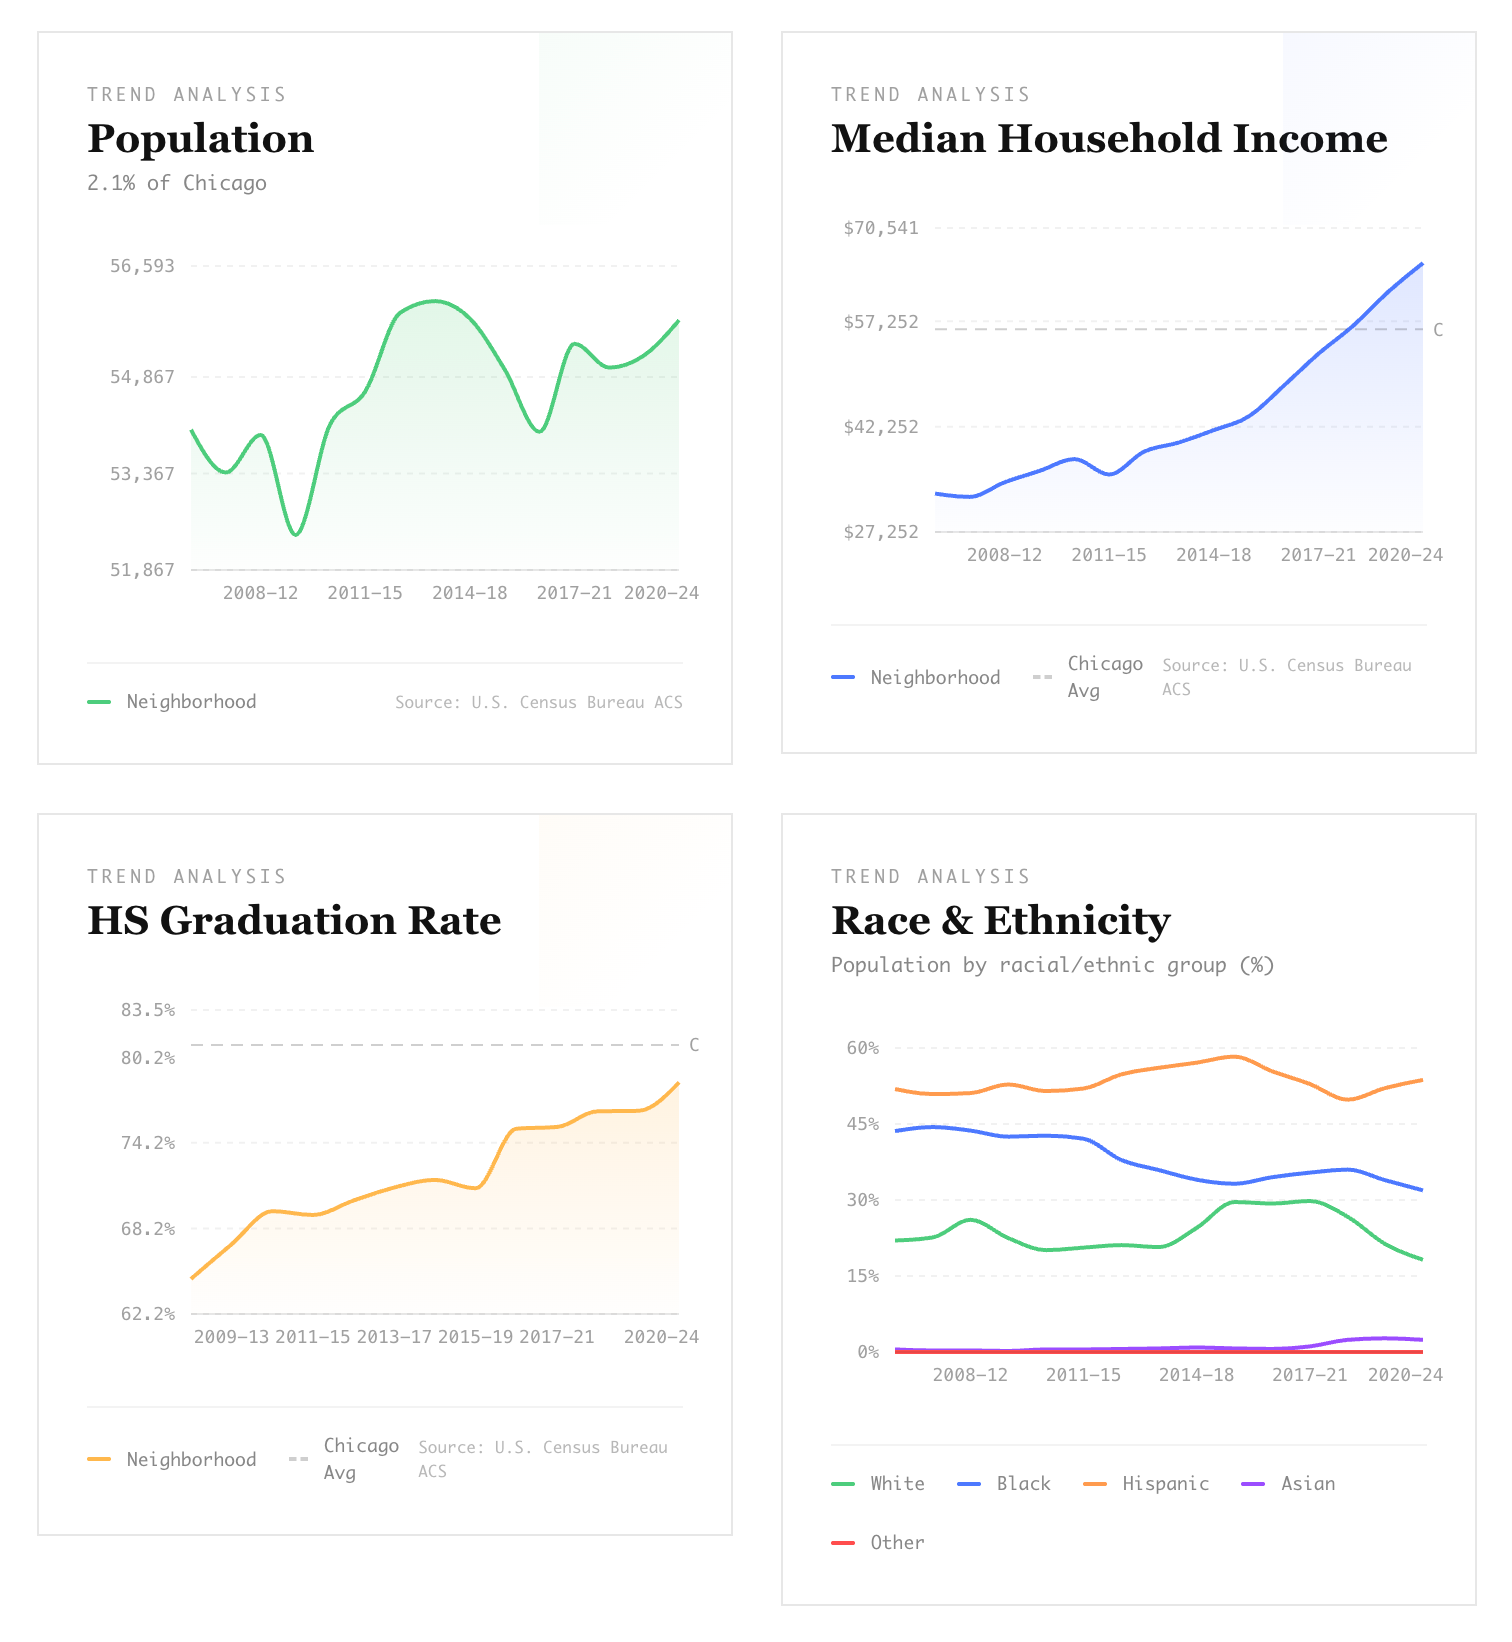
Each report includes contextual information that helps nonexperts understand what the numbers mean. Population growth isn't just a percentage. It's explained in terms of housing demand and infrastructure needs. Business registration trends come with insights about economic momentum and development opportunities.
RealWorld Applications That Drive Results
Consider preparing for a city council meeting where you're advocating for small business support programs. Instead of spending your weekend compiling statistics, you generate a comprehensive neighborhood economic profile in minutes. The report shows current business density, recent registration trends, employment data, and demographic shifts—all formatted for easy presentation.
Or picture this scenario: a potential corporate partner wants to understand community needs before committing to a workforce development program. Rather than scrambling to gather relevant data, you produce a detailed community profile that demonstrates both challenges and opportunities, complete with visual charts and key takeaways.
The speed advantage becomes crucial during grant application seasons, when multiple opportunities arise simultaneously. Teams can quickly generate supporting data for different proposals, tailoring each report to specific funder interests without starting from zero each time.
Beyond Speed: Strategic Advantages
Quick report generation enables more frequent community assessments, helping organizations spot trends earlier and adjust programs accordingly. When data gathering takes minutes rather than hours, it becomes feasible to create monthly neighborhood snapshots, track progress on key initiatives, and respond rapidly to emerging opportunities.
This accessibility also democratizes data within organizations. Program staff who previously relied on others for statistical support can now generate their own reports, freeing up senior leaders for higher-level analysis and strategy. Board members can access current data between meetings, leading to more informed discussions and decisions.
The consistency of automated report formatting also builds credibility with external stakeholders. Professional-looking documents with reliable data sources enhance organizational reputation and increase the likelihood of securing partnerships, funding, and policy support.
What This Means for Community Leaders
Time-consuming data compilation no longer needs to be a barrier to evidence-based decision making. When report generation takes minutes instead of hours, community organizations can operate more strategically, respond more quickly to opportunities, and demonstrate impact more effectively to stakeholders.
From the Author
Ready to save some time?
Sign up for free or book a demo to see how quick report generation can transform your organization's data capabilities.
Sign up! →